

Table of Contents
Introduction
Understanding market structure is one of the most transformative skills any trader can develop. It is the backbone of price action, the invisible framework that shapes every chart, and the most reliable guide for understanding what the market is doing and where it is likely to go next. For most beginners, price charts feel chaotic. Candles rise and fall without apparent logic, indicators flash conflicting signals, and trading decisions quickly turn into emotional guesses instead of structured choices.
The real issue is not the chart itself; it is the lack of structure in how the trader reads it. Without understanding market structure, every move looks random. Once you grasp structure, the same chart begins to tell a very clear story. You start seeing how price swings form, how trends build, where reversals usually begin, and why certain levels consistently act as turning points. You begin to trade with intention instead of hope.
Market structure is the language of the market. It represents the ongoing battle between buyers and sellers, it reveals where liquidity is building, and it highlights the zones where large players are likely to enter or exit positions. This guide will walk you step by step through the foundations of market structure—from basic trends and swing points to BOS (Break of Structure), CHOCH (Change of Character), and the role of liquidity. By the end, you will be able to look at any chart and read its story with far more confidence.
1. What Is Market Structure? (Beginner-Friendly Definition)
Market structure is the natural arrangement of swing highs and swing lows created as price moves over time. These swings form repeating patterns that reveal whether the market is trending upward, trending downward, or moving sideways in a range. It does not matter whether you are looking at Forex, Gold, Crypto, Futures, or Stocks; the way structure forms is always the same because it reflects the same underlying human behaviour.
At the most basic level, market structure answers a single question:
Who is currently in control: buyers or sellers?
When buyers are in control, they push prices higher, creating a pattern of higher highs and higher lows. When sellers are in control, they drive prices lower, forming lower highs and lower lows. When neither side dominates, the market moves sideways and forms equal highs and equal lows.
Here is a simple summary of these structures:
| Market Condition | Description | Swing Pattern |
|---|---|---|
| Uptrend | Buyers dominate and push price higher | Higher Highs (HH) + Higher Lows (HL) |
| Downtrend | Sellers dominate and push price lower | Lower Highs (LH) + Lower Lows (LL) |
| Range | No clear control; price moves sideways | Equal Highs (EQH) + Equal Lows (EQL) |
These patterns are not coincidences. They occur because institutional and retail traders repeatedly react at similar levels, place similar types of orders, and respond to similar emotions—fear, greed, and FOMO. Market structure is powerful because it reflects real-time market psychology, not just mathematical averages like indicators.
2. Why Market Structure Matters More Than Indicators
Many traders start their journey filled with indicators: moving averages, RSI, MACD, Bollinger Bands, stochastic, and more. Indicators can be useful, but they all share one limitation: they are based on past data. They lag behind price. By the time an indicator confirms a trend, the best entry is often gone.
Market structure, in contrast, forms with each new swing in real time. When you learn to read structure, you gain direct insight into what price is doing right now, rather than what it did twenty candles ago.
Understanding market structure allows you to:
- Identify the dominant trend before entering a position
- See where the market is preparing to reverse, instead of reacting too late
- Avoid trades taken in the middle of nowhere, far from key structural levels
- Choose more accurate areas for entries, stop-losses, and take-profits
- Recognise when the market is choppy and better to avoid
- Filter out many losing trades by trading only with the structural trend
Every serious price-action approach—smart money concepts, supply and demand, order-block trading, support and resistance, breakout trading—rests on market structure. Once structure becomes clear to you, indicators become optional tools rather than the main decision-makers.
3. The Three Pillars of Market Structure
Market structure is built on three core pillars. When you understand these, any chart becomes far easier to read:
- Trends – Uptrend, downtrend, and range
- Swing highs and swing lows – The turning points
- Support and resistance – Key reaction levels
Let’s go through them one by one.
3.1 Pillar 1 – Trends (Uptrend, Downtrend, Range)
A trend is the general direction in which the market is moving. Traders often overcomplicate trend identification, but it becomes simple when you focus on the sequence of swings.
- In an uptrend, each successive high is higher than the last, and each pullback forms a higher low.
- In a downtrend, each bounce upward is weaker than the previous one, and price keeps making new lower lows.
- In a range, highs and lows stop progressing and price instead oscillates between two key levels.
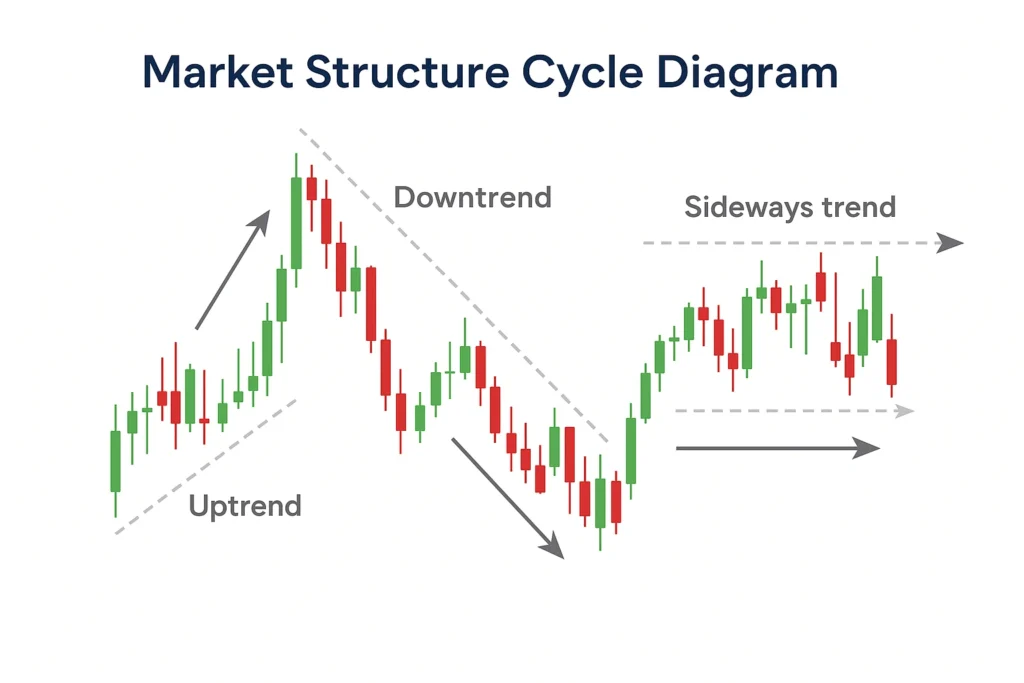
This diagram helps readers quickly see that:
- There are only three possible structural states at any moment.
- Every trading strategy must first identify which state the market is in.
- Profits come from aligning trades with the current structure, not fighting it.
3.2 Pillar 2 – Swing Highs and Swing Lows
Swing points are the building blocks of structure. A swing high is a peak where price stops rising and starts falling; a swing low is a trough where price stops falling and starts rising. These points draw the “skeleton” of the chart and allow you to define the trend.
Swing points are important because they:
- Define whether the market is in an uptrend, downtrend, or range
- Highlight clear reaction levels where price has previously turned
- Show where liquidity accumulates (stops usually sit above highs and below lows)
- Provide natural areas for stops and targets
- Reveal when momentum is weakening or strengthening
In a healthy uptrend, swing highs keep breaking previous highs, and swing lows keep forming above the prior swing lows. In a healthy downtrend, the opposite is true.

This diagram helps beginners visually lock in the idea that:
- Swings alternate: low, high, low, high …
- The trend is defined by how these swings progress over time.
3.3 Pillar 3 – Support and Resistance
Support and resistance are zones where price has reacted strongly in the past. These levels often coincide with important swing highs or swing lows and act as magnets and barriers for future price movement.
| Level Type | What It Represents | How Traders Use It |
|---|---|---|
| Support | An area where price previously bounced upward | Look for buying opportunities, place stops below it |
| Resistance | An area where price previously rejected downward | Look for selling opportunities, place stops above it |
Support and resistance are most powerful when they align with trend direction and with prior swing points. For example, in an uptrend, previous resistance that turns into support often becomes a high-probability area to look for new longs.
4. Uptrends, Downtrends, and Ranges in Detail
Recognising the current market condition is the first step before pressing the buy or sell button. Each condition has its own logic and “rules”.
4.1 Uptrend Structure
In an uptrend, buyers are clearly in control. Price moves in a stair-step pattern: it pushes up to a new higher high, then pulls back to a higher low, then continues higher again.
Key characteristics of a strong uptrend include:
- The distance between highs is not shrinking dramatically
- Pullbacks respect previous support areas and form higher lows
- Breakouts through resistance often follow through instead of failing immediately
The best way to trade an uptrend is rarely to buy the breakout at the very top. Instead, professional traders focus on pullbacks into structure—higher lows near support, previous resistance turned support, or aligned with higher-timeframe demand zones.
4.2 Downtrend Structure
A downtrend is the mirror image. Sellers dominate and price forms lower highs and lower lows. Each attempt by buyers to push the market higher fails earlier than the last, and sellers use those rallies to enter new positions.
Key characteristics of a strong downtrend:
- Lower highs form consistently as rallies get weaker
- Lower lows break previous lows, confirming continuation
- Retracements into resistance are often sold aggressively
Trying to “catch the bottom” in a strong downtrend is one of the fastest ways for beginners to lose money. Unless the structure shows clear signs of reversal, it is safer to look for short entries at lower highs instead of guessing reversals.
4.3 Ranges – The Beginner Danger Zone
A ranging market forms when neither buyers nor sellers can take control. Price simply oscillates between a well-defined ceiling (resistance) and floor (support). While ranges can be traded profitably by experienced traders, they are very dangerous for beginners because:
- Fake breakouts are common
- Signals from indicators are unreliable
- Price can reverse sharply with little warning
- You can get chopped up by entering in the middle of the range
For most beginners, the safest approach is to:
- Avoid trading when the market is clearly ranging, or
- Trade only at the extreme boundaries with tight risk, or
- Wait patiently for a clean breakout and retest that leads into a new trend.
5. Break of Structure (BOS) vs Change of Character (CHOCH)
Once you can read trends and swings, the next level is understanding BOS and CHOCH. These two concepts help you answer: “Is the trend continuing or is it starting to reverse?”
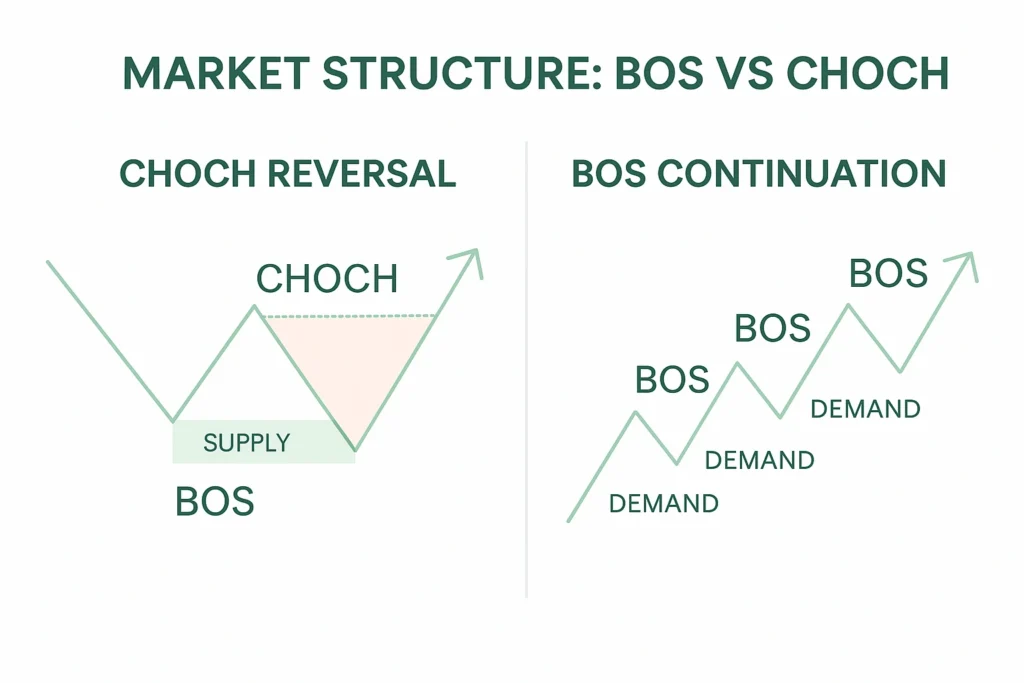
5.1 Break of Structure (BOS)
A Break of Structure happens when price breaks a previous swing high in an uptrend or a previous swing low in a downtrend. It confirms that the trend direction is still intact.
- In an uptrend: price makes a new Higher High above the previous high.
- In a downtrend: price makes a new Lower Low below the previous low.
BOS signals that continuation is more likely and encourages you to keep trading with the trend, looking for pullbacks rather than trying to fade the move.
5.2 Change of Character (CHOCH)
A Change of Character is the first structural sign that a reversal may be forming. It occurs when price breaks structure against the current trend:
- In an uptrend: price fails to form a higher low and instead breaks below the last swing low, creating a new Lower Low.
- In a downtrend: price fails to form a lower high and instead breaks above the last swing high, creating a new Higher High.
CHOCH does not guarantee an immediate full trend reversal, but it is an important warning sign. At minimum, it tells you to stop blindly trading with the old trend and wait for more confirmation.
5.3 BOS vs CHOCH Summary Table
| Concept | Meaning | Impact on Trend | Trading Implication |
|---|---|---|---|
| BOS | Break of Structure | Confirms trend continuation | Look for pullbacks to rejoin the existing trend |
| CHOCH | Change of Character | Suggests possible reversal | Pause trading with the old trend, wait for new structure to form |
6. Higher Timeframe (HTF) vs Lower Timeframe (LTF) Structure
Even when you understand structure, using a single timeframe can still be limiting. Professional traders combine higher-timeframe and lower-timeframe views to gain both context and precision.
- The Higher Timeframe (HTF)—such as 4H, 1H, or 30M—gives the big-picture direction, key zones, and major liquidity areas.
- The Lower Timeframe (LTF)—such as 15M, 5M, or 1M—provides the detailed entries, stop-loss levels, and intraday structure shifts.
A simple rule that can dramatically improve a beginner’s win rate is:
- If the HTF is bullish, only look for long setups on the LTF.
- If the HTF is bearish, only look for short setups on the LTF.
- If the HTF is ranging, consider waiting for a breakout before trading aggressively.
This alignment between HTF and LTF filters out many bad trades that go against the bigger picture.
To expand your understanding of how market structure fits into a complete trading system, it’s helpful to see how these concepts integrate with planning, risk management, and execution. A great next step is reviewing our guide on how to create a successful trading plan, which shows how structure, liquidity, and trend analysis work together in real trading decisions. For broader foundational context, you can also explore the general overview of market structure on Wikipedia, a consistently reliable educational resource. Combining these insights will help you build a clearer, more disciplined approach to analysing and trading the markets.
7. Liquidity and Its Relationship With Market Structure
Liquidity is the fuel that powers price movement. It refers to clustered orders—stop-losses, pending orders, and large institutional positions—often resting above obvious highs and below obvious lows. The market frequently moves towards these liquidity pools to fill big orders before reversing or continuing.
Common liquidity locations include:
| Location | Reason Liquidity Builds There |
|---|---|
| Above swing highs | Buy stops, breakout buys, short stops |
| Below swing lows | Sell stops, panic exits, long stops |
| Equal highs | Double-top traders and breakout orders |
| Equal lows | Double-bottom traders and sell stops |
| Fair Value Gaps | Inefficiencies institutions like to rebalance |
| Round numbers | Psychological levels where many orders cluster |
When liquidity is swept—price spikes above a high or below a low and then sharply reverses—it often marks the beginning of a CHOCH and a potential new trend. This is why smart money-style traders wait for liquidity grabs plus structural change instead of entering at the first breakout.
Conclusion: Master Market Structure, Master the Market
Market structure is not just another trading concept; it is the framework that makes every other concept make sense. Once you learn to read trends, swings, BOS, CHOCH, and liquidity, the chart stops looking random. You can see when the market is trending, when it is ranging, and when it is transitioning from one state to another. You understand where smart money is likely entering, where beginners are being trapped, and where the safer entries lie.
By aligning yourself with structure instead of emotion, you:
- Stop buying tops and selling bottoms
- Stop chasing every candle and start waiting for quality setups
- Place your stops and targets in logical locations instead of guessing
- Trade with a clear plan instead of reacting to fear and FOMO
This guide gives you the roadmap. Now, once you add your three clean diagrams—Market Structure Cycle, Swing Highs & Swing Lows, and BOS vs CHOCH—your article will be visually engaging, educational, and ready to publish on your website as a professional trading resource.