

Table of Contents
Candlestick patterns are one of the most trusted tools in technical analysis, offering powerful clues about market momentum, reversals, and entry points. Whether you trade forex, stocks, or futures, understanding these patterns can give you a real edge in timing your trades with precision. In this beginner-friendly guide, you’ll learn how to read candlestick charts, recognize the most reliable bullish and bearish patterns, and apply them with confidence. Ready to decode market signals like a pro? Let’s dive in.
What Are Candlestick Patterns?
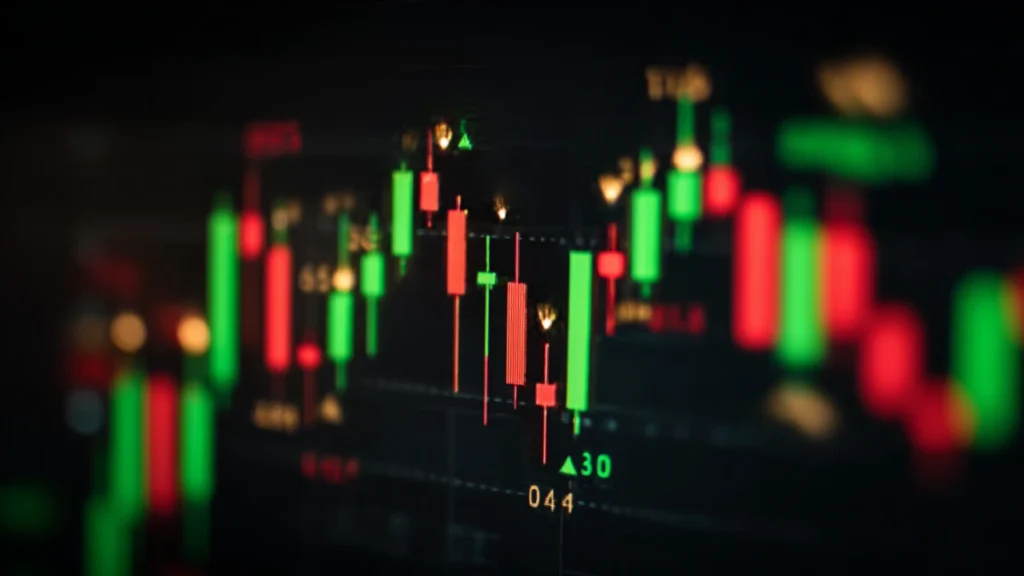
Candlestick patterns are visual formations on a price chart that reflect the behavior of buyers and sellers during a specific time period. Each candlestick shows four key pieces of information: the opening price, closing price, highest price, and lowest price within that time frame. When multiple candles form recognizable shapes or sequences, they can signal potential reversals, continuations, or indecision in the market.
These patterns are a core part of technical analysis and have been used by traders for centuries. Learning how to read and interpret them helps you anticipate price movements, improve your timing, and make more confident trading decisions.
How to Read a Candlestick
A single candlestick tells a complete story about price action during a specific period. Each candle consists of two main parts:
• The Body: This is the thick part of the candle. It shows the difference between the opening and closing prices.
o If the close is higher than the open, the candle is typically green or white (bullish).
o If the close is lower than the open, the candle is usually red or black (bearish).
• The Wicks (or Shadows): These are the thin lines above and below the body, showing the highest and lowest prices reached during the session.
o The upper wick shows how high the price went.
o The lower wick shows how low it dropped.
Understanding the shape and position of the body and wicks gives insight into market strength, rejection zones, and potential reversals.
Top 7 Candlestick Patterns Every Beginner Should Know
Let’s break down the most common and reliable candlestick patterns that traders use to spot market reversals and continuations. These patterns appear frequently across all markets and timeframes, making them essential for any beginner to recognize.
- Doji
A doji forms when the opening and closing prices are almost equal, creating a very small body. It signals market indecision and potential reversal, especially after a strong trend.
What it means: Bulls and bears are in balance — watch for confirmation from the next candle.
- Hammer
A hammer has a small body with a long lower wick and little to no upper wick. It usually appears at the bottom of a downtrend and signals a possible bullish reversal.
What it means: Buyers stepped in after sellers pushed prices lower, showing buying strength.
- Shooting Star
The opposite of a hammer, a shooting star has a small body with a long upper wick. It appears at the top of an uptrend and suggests a bearish reversal.
What it means: Buyers pushed prices up but couldn’t sustain it — sellers took control.
- Bullish Engulfing
This pattern occurs when a small bearish candle is followed by a larger bullish candle that completely engulfs it. It usually signals a strong reversal to the upside.
What it means: Buyers overwhelmed sellers and may push prices higher.
- Bearish Engulfing
A small bullish candle followed by a large bearish one that completely covers it. This pattern signals a potential trend reversal to the downside.
What it means: Sellers are taking over, and a drop could follow.
- Morning Star
A three-candle pattern: a large bearish candle, followed by a small indecisive candle (often a doji), and then a large bullish candle. It signals a potential bottom and reversal upward.
What it means: The downtrend is weakening, and buyers are stepping in.
- Evening Star
The bearish version of the morning star. It starts with a strong bullish candle, followed by a small candle, and ends with a strong bearish candle. It signals a possible top.
What it means: Momentum is shifting from buyers to sellers.
Tips for Using Candlestick Patterns Effectively
Candlestick patterns are powerful, but they work best when combined with other tools and techniques. Here are some essential tips to make the most of them in your trading:
- Always Use Confirmation
Don’t trade based on a pattern alone. Wait for the next candle to confirm the move, or use indicators like volume, moving averages, or support and resistance levels to strengthen your setup.
- Look at the Bigger Picture
Zoom out and check the overall trend. A bullish reversal pattern in a strong downtrend might not be reliable unless supported by other signals. Context matters.
- Combine with Key Levels
Candlestick patterns are most effective when they appear at significant levels like previous highs/lows, trendlines, or Fibonacci zones. These add weight to the signal.
- Avoid Overtrading
Not every pattern is worth trading. Stick to the high-probability setups and don’t force trades just because a pattern forms.
- Practice on Historical Charts
Before using them live, go back and study how these patterns played out in the past. This builds your pattern recognition skills and improves your confidence.
Common Mistakes Beginners Make with Candlestick Patterns
Even though candlestick patterns are simple to learn, beginners often fall into common traps. Avoiding these mistakes will save you frustration and money.
- Relying on Patterns Alone
A candlestick pattern without context is just a shape. Don’t assume a reversal is coming just because you see a hammer or engulfing pattern. Always check trend direction and other confluences.
- Ignoring Timeframes
A pattern that looks strong on the 1-minute chart might be irrelevant on the 1-hour chart. Stick to timeframes that match your trading style and avoid overanalyzing small candles.
- Entering Too Early
Many traders jump in the moment a pattern appears. Always wait for confirmation — the next candle, a volume increase, or a break of structure — to reduce false signals.
- Overloading the Chart
Trying to memorize and spot 20 different patterns will lead to confusion. Focus on mastering a few high-probability ones first.
- Misreading Reversal vs Continuation
Not all patterns mean reversal. Some, like the bullish engulfing, can appear mid-trend and signal continuation. Know the difference and read them in context.
Conclusion
Candlestick patterns are more than just chart visuals — they are a language that reflects the ongoing battle between buyers and sellers in the market. For beginner traders, mastering this language is one of the most valuable skills you can develop early in your journey. These patterns offer a window into market sentiment, helping you make smarter, more confident decisions when it comes to entering or exiting trades.
But remember, candlestick patterns are not magic signals. They don’t guarantee success on their own.
The key is context — combining these patterns with support and resistance zones, trend direction, volume, and other indicators will significantly increase their accuracy. Learning to read candlesticks effectively can elevate your trading strategy, sharpen your instincts, and reduce emotional decisions.
If you’re just starting out, focus on 3–5 core patterns and practice spotting them on historical charts. Use screenshots, journal your trades, and track what works. Over time, these visual cues will become second nature, allowing you to anticipate price action with more clarity and control.
The journey to trading success is built on discipline, patience, and education. Candlestick patterns give you a strong foundation, but the real growth comes from consistent practice and learning from both wins and losses. Stick with it — and with every chart you study, you’ll become a better, more informed trader.
Candlestick patterns are not just visual representations of price—they’re the emotional fingerprints of the market, capturing the battle between buyers and sellers in real time. Understanding how to read them gives traders a unique edge, especially when combined with key tools like volume indicators, support/resistance levels, and moving averages. For example, a bullish engulfing pattern at a major demand zone is far more significant than the same pattern appearing randomly in the middle of a range. But to truly harness their power, traders must learn to interpret these patterns within the broader market context rather than treating them as standalone signals.
Whether you’re day trading forex, analyzing crypto, or swing trading stocks, candlestick analysis can help you pinpoint powerful entry and exit zones — and even avoid traps that snare impatient traders. Beginners often get stuck chasing patterns without truly understanding what those candles are telling them. That’s why it’s crucial to study not only the shape of the candle but also what happened before it and what levels are nearby. Are buyers losing momentum? Are sellers absorbing demand?
These questions matter far more than simply spotting a “hammer” or a “doji.” In fact, many seasoned traders recommend mastering just a few core patterns like the bullish engulfing, hammer, and morning star — and pairing them with solid confirmation tools like trendlines, volume spikes, or moving average crossovers.
A great starting point for further deep learning is this in-depth guide on candlestick patterns from Investopedia, which breaks down both basic and advanced concepts with illustrations. And if you want to reinforce this visual skill with another essential tool, check out our internal article on What Is a Moving Average in Trading? (Beginner’s Guide to SMA vs EMA + How to Use Them 2025).
When used together, moving averages and candlestick patterns can help you spot momentum shifts before they explode. So if you’re serious about leveling up your trading skills, take time to practice identifying these setups on historical charts, log them in a journal, and track how they behave near major zones. Over time, you’ll not only become fluent in reading candlestick patterns — you’ll be able to anticipate price action with confidence, discipline, and a real edge in the markets.