
🟡 Gold Futures Analysis – May 22, 2025

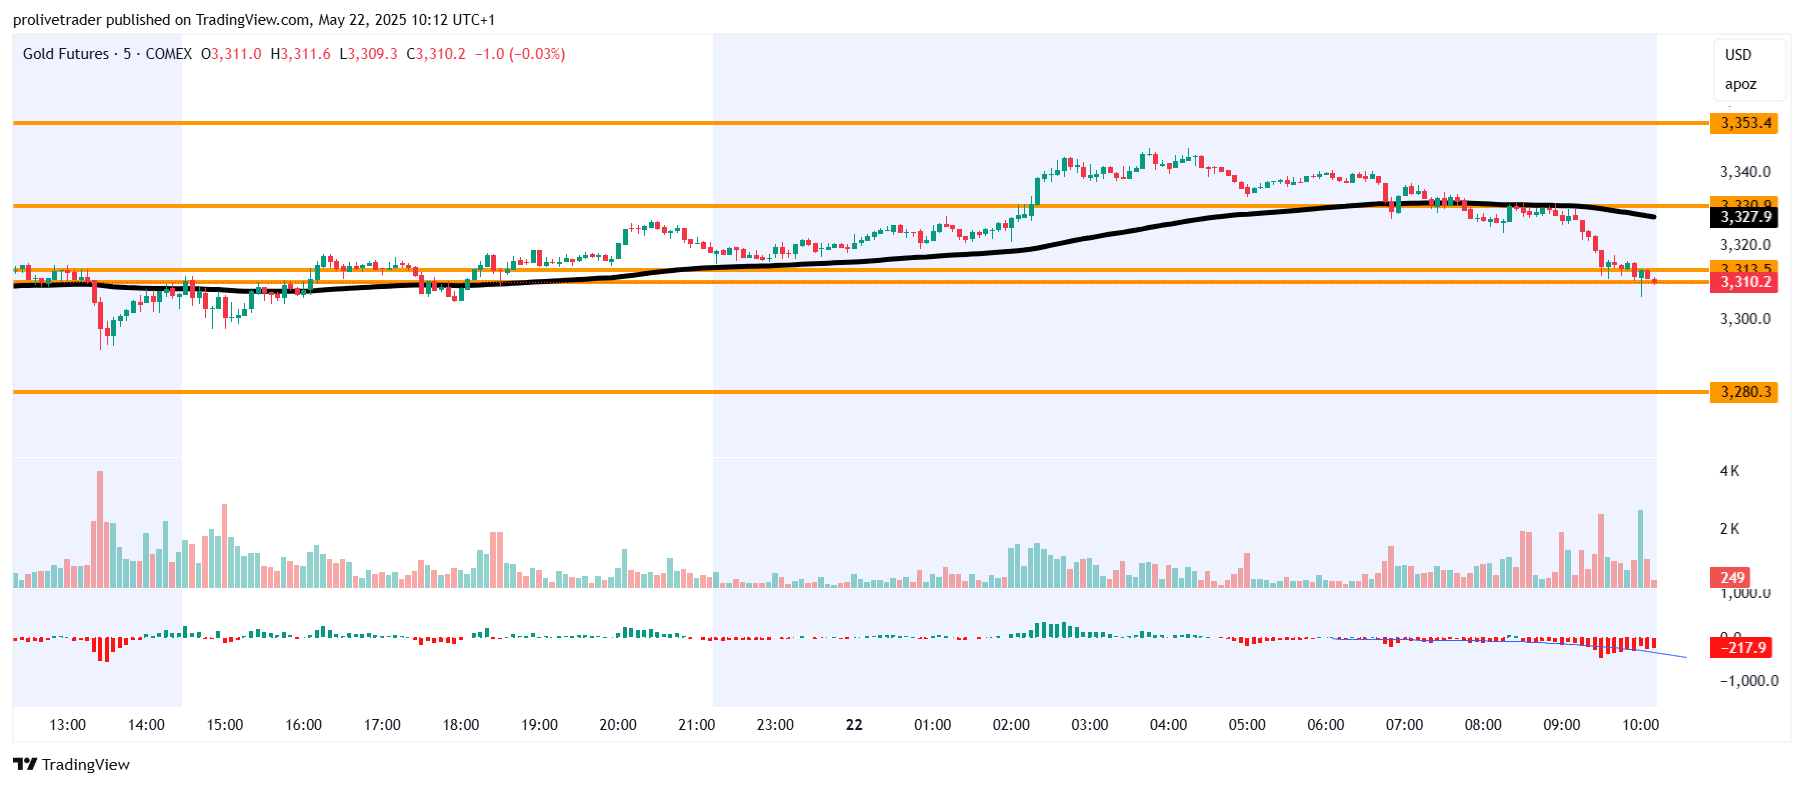
Today’s price action on Gold (GC) is unfolding within a well-defined structure, and traders should be especially attentive to the key pivot levels highlighted in the chart. The session has begun with clear bearish momentum, as price has moved below the 114 EMA, indicating a shift in short-term market sentiment.
🔍 Key Technical Notes
The orange lines represent major intraday pivots based on higher timeframe structure. These zones are not fixed support or resistance — they are critical decision points. The reaction at these levels tells us everything.
On the 5-minute chart, price is currently testing the $3,310 pivot, showing early signs of buyer hesitation. Volume is increasing while the Belkhayate Énergie remains deeply negative — a sign that sellers may still have control for now.
Earlier rejection from the $3,329 area confirmed that buyers were not strong enough to hold the previous structure, and this led to a clean selloff into today’s lower zones.
⚠️ What Traders Should Watch For
Volume and Energy: When price interacts with pivot zones, volume and energy readings become the real confirmation. Strong buyers showing up at a pivot (with volume + positive momentum shift) could indicate a potential reversal. Weak responses? Expect continuation.
Do Not Predict — React: Even though we are below the EMA and short-term sentiment is bearish, we trade the present, not the forecast. A clean reclaim above the EMA with buyer energy can flip the bias quickly.
📌 Summary
Market Bias: Bearish below EMA, but waiting on confirmation.
Current Action: Testing $3,310 pivot after rejection from $3,329.
Focus: Watch for volume and energy at the $3,310 and $3,280 pivots for either continuation or a bounce.
Reminder: We trade what the market gives — not what we want.
🛢️ CL Market Outlook – May 22, 2025

In today’s session, price action on the 15-minute chart has established a clear intraday trading range, marked between the $61.73 swing high and the $61.10 swing low. This boxed range currently defines short-term market equilibrium. Price is trading within this area after rejecting lower levels earlier this morning.
This consolidation zone is important because it acts as a decision-making zone. A breakout in either direction — confirmed by strong volume and momentum — could shape the rest of the trading day. If price breaks above $61.73, we could see continuation of bullish momentum, while a drop below $61.10 would open the path for a renewed bearish move.
🔶 Key Levels & Structural Pivots
The orange horizontal lines represent key structural pivots derived from higher timeframes. These zones often act as reaction points, either for trend continuation or potential reversal depending on how price interacts with them.
What’s important is not just the level itself, but how price behaves around it. We look for clear reactions — strong candles, meaningful volume surges, and directional momentum as shown through buyer/seller energy. If price taps a pivot zone and fails to break with conviction, it may signal exhaustion and potential reversal. On the other hand, a clean breakthrough with strong follow-through often confirms continuation.
📊 Volume & Energy Watch
Volume and energy indicators are crucial at these key levels. A rise in volume and buyer energy near the lower pivot zones (e.g., $60.17 or $59.66) can signal accumulation or reversal interest. Conversely, surging sell pressure at resistance levels could reinforce bearish momentum.
Today, we saw a sharp rejection off the morning lows with increasing volume, but this rebound is still inside the broader trading box. Until we see a decisive breakout, price remains in balance.
Summary:
Range Bound: Price is currently confined between $61.73 and $61.10.
Bias: Neutral until range is broken.
Key Watch: Reactions at orange pivot zones — they will define whether the trend continues or stalls.
Confirmation Tools: Look for strong candles, volume surges, and energy alignment before entering.
This structure offers a clean trading roadmap for the day — all eyes remain on whether price chooses to break from this consolidation zone or remain trapped within.