

What Happened Today?
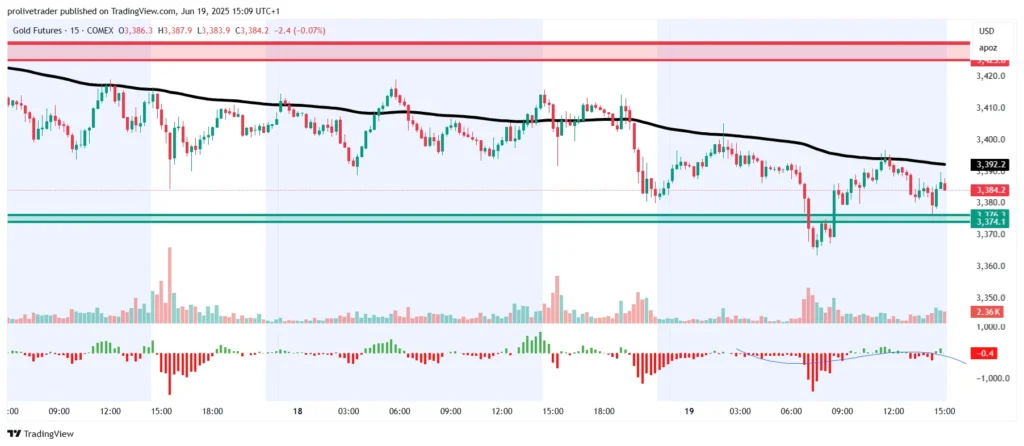
Gold (GC) traded in a controlled bearish structure throughout today’s session. Price has remained below the declining 114 EMA on the 15-minute chart, with sellers firmly in control since last week’s high near the 3430 level.
After testing resistance multiple times during the early London session, GC failed to reclaim key intraday highs and gradually drifted lower through the US morning, testing into a strong demand zone below — the green area on the chart.
Despite some intraday attempts to bounce, no meaningful bullish momentum has appeared yet. Volume remains muted and Belkhayate Énergie is still flat to negative, suggesting no immediate reversal is in play. I am now watching this green demand zone very closely for a potential shift.
Current Market Structure
✅ Overall Trend: Bearish — lower highs and lower lows on the 4H and 15M charts
✅ EMA: 114 EMA sloping downward — no bullish reclaim so far
✅ Support Zone: The green demand zone just below current price — strong buyer reaction likely if tested with force
✅ Resistance Zone: The red supply zone overhead — prior sell-off originated here with heavy selling pressure
Trade Scenarios I’m Watching
Scenario 1 — Bullish Reversal (Primary Plan):
If price fully tests the green demand zone and I observe a strong reaction from buyers (confirmed by order flow on the 19-range chart and rising energy), I will look to enter a long position targeting the upper red zone. My stop-loss will remain very tight — just below the demand zone — to manage risk in case sellers remain dominant.
Scenario 2 — Short Opportunity from Red Zone:
If price spikes toward the red zone first, I will switch bias and look for a short back toward the green zone, especially if buyers become trapped at resistance and selling volume confirms weakness.
Key: I do not blindly enter at zones — I confirm entries by watching live order flow, volume spikes, and energy divergence to catch trading traps or aggressive flows inside the zones.
Technical Summary
Trend: Bearish short-term; neutral HTF bias as gold remains in wide consolidation
EMA: Price below declining 114 EMA
Next Key Action: Waiting for reaction at either green demand or red supply zone
Strategy: Only trade with order flow confirmation; trap-based setups preferred
What Is Driving Gold Right Now?
1️⃣ Geopolitical Tension Supporting Safe-Haven Demand
Ongoing Middle East tensions — following recent Israeli strikes on Iranian targets — have sparked renewed interest in safe-haven assets. Gold remains supported by rising geopolitical risks, with investors hedging against potential escalation. Oil prices have also surged, which typically fuels bullish sentiment for gold as inflation fears increase.
2️⃣ Central Bank Demand Remains Strong
Global central banks continue accumulating gold at record pace. The World Gold Council reports over 1,000 tonnes purchased in 2024 — well above long-term averages. Many emerging market banks are diversifying away from the US dollar and seeking inflation protection through physical gold reserves.
3️⃣ US Federal Reserve Policy Uncertainty
The Federal Reserve has maintained rates at 4.25–4.50%, while signaling caution on inflation. Markets currently expect one to two rate cuts by late 2025, though hawkish comments from Fed officials have recently tempered expectations. A slower path to rate cuts would typically weigh on gold, but safe-haven demand is currently offsetting this.
4️⃣ Mixed Economic Data
Recent US data has painted a mixed picture. Cooling CPI inflation suggests easing price pressures, but labor markets remain tight. Housing starts have slowed, hinting at potential economic softness ahead — a bullish backdrop for gold if confirmed in future reports.
Market Outlook
Short-term outlook: Gold remains supported by geopolitical tension and demand from central banks, despite Fed hawkishness. I remain bullish while watching for price reaction at key technical zones.
Medium-term outlook: Mixed — potential for consolidation or correction if tensions ease and global growth picks up. However, ongoing central bank buying and retail investor flows remain strong pillars of support.
Risks: If geopolitical risks fade quickly or US data improves sharply, gold could face a pullback toward lower support zones.
🛢️ Crude Oil Futures (CL) Technical Analysis — 19 June 2025
What Happened Today?
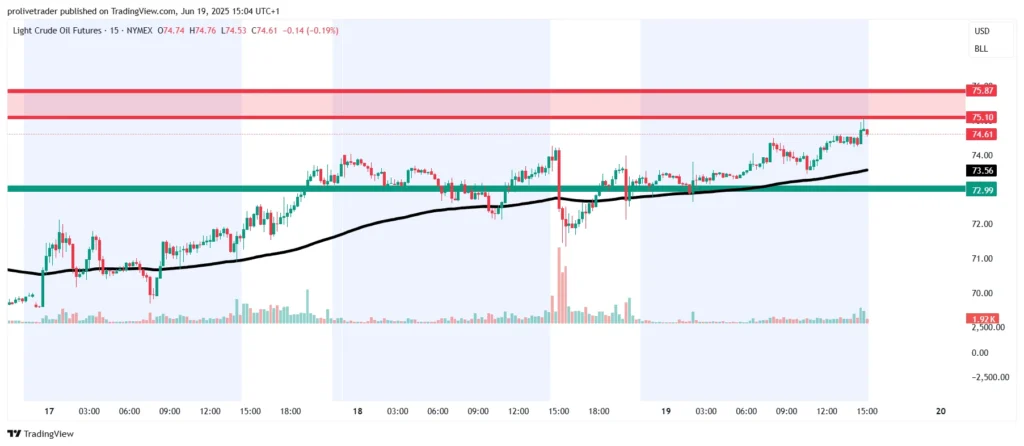
Crude Oil Futures (CL) extended its bullish momentum today, continuing the strong uptrend that began after last week’s bounce off key demand zones. Price action on the 15-minute chart has remained consistently bullish, forming higher highs and higher lows while respecting the rising 114 EMA.
During today’s London and early US session, CL advanced toward a major red supply zone, which now serves as the next critical decision area for price action. Volume has been increasing during the climb, and Belkhayate Énergie is rising — both signs of strong underlying momentum.
At the time of writing, CL is trading just under this key supply zone — a prime location for potential breakout or reversal setups.
Current Market Structure
✅ Overall Trend: Strong bullish — both 15M and 4H trends remain to the upside
✅ EMA: 114 EMA rising — price trading well above this level, confirming bullish control
✅ Support Zone: Green demand zone (72.99 area) where buyers previously took control
✅ Resistance Zone: Red supply zone currently being tested — major cluster of past sell orders
Trade Scenarios I’m Watching
Scenario 1 — Breakout Continuation (Primary Plan):
If CL breaks above the red supply zone with rising volume and sustained energy on the Belkhayate indicator, I will look to enter a long trade targeting higher resistance levels. Confirmation will come from order flow on the 19-range chart, where I want to see aggressive buyers in control with no absorption.
Scenario 2 — Short Reversal from Supply Zone:
If buyers get trapped at the red zone or energy shows divergence, I will shift bias and look for a short trade back toward the green demand zone. Trapped buyers and exhaustion are key signals I will look for — I won’t short blindly.
How I Confirm My Entries
I always rely on confirmation before entering:
✅ Order Flow: Using the 19-range chart to detect traps, aggressive buying/selling, or exhaustion
✅ Volume: Looking for rising volume on breakouts or signs of weakness on failed pushes
✅ Belkhayate Énergie: Confirming momentum strength or divergence for reversals
I stay patient at key zones — I trade the reaction, not the zone itself.
Technical Summary
Trend: Strong bullish — higher highs and higher lows on both intraday and 4H
EMA: Price trading above rising 114 EMA
Next Key Action: Watching price reaction at red supply zone
Strategy: Look for breakout continuation or trap reversal — only enter with order flow and momentum confirmation
This analysis aligns perfectly with the current market structure in crude oil. Whether CL breaks out or rejects here will set the tone for the next major move — and I’m ready to react either way.
🌍 Crude Oil Futures (CL) Fundamental Analysis — 19 June 2025
What’s Driving Crude Oil Prices Right Now?
1️⃣ Geopolitical Tensions in the Middle East Fueling Oil Rally
Rising tensions in the Middle East — after this week’s Israeli strikes on Iran — are lifting global crude oil prices. WTI futures climbed above $75 today, as traders hedge against potential supply disruptions in an already tight market. The geopolitical risk premium is back in focus, supporting bullish sentiment.
2️⃣ OPEC+ Maintains Production Cuts
OPEC+ members recently reiterated their commitment to current production cuts through Q3 2025. With global inventories already low, this stance further tightens supply — a major factor behind the latest bullish breakout in crude oil futures.
3️⃣ Strong Demand Outlook Amid Summer Driving Season
In the US and Europe, summer driving demand remains strong. Refinery utilization rates are high, and US gasoline demand data showed its strongest seasonal print since 2022. This seasonal effect is pushing up front-month WTI futures.
4️⃣ US Dollar & Fed Policy Impact
While the Federal Reserve has paused rate hikes, the US dollar remains relatively firm, slightly capping gains in commodities priced in USD. However, oil markets remain more sensitive to supply/demand fundamentals than FX at the moment.
5️⃣ Global Economic Data Still Mixed
Recent macroeconomic releases from China (industrial production) and the US (retail sales) have been mixed, keeping traders on alert. A soft global growth outlook could limit long-term upside in oil — but short-term momentum is driven by supply risks and seasonal demand.
Market Outlook
Short-term: Bullish — as long as Middle East tensions persist and demand stays firm.
Medium-term: Cautious — possible pullback later in Q3 if geopolitical risks ease and demand normalizes.
Risks: De-escalation in the Middle East or surprise increases in supply (such as US shale response) could trigger corrections.
For traders looking to deepen their understanding of Gold Futures Technical Analysis and Crude Oil market dynamics, it’s essential to stay informed with trusted global resources. The World Gold Council offers in-depth reports on central bank gold reserves and demand trends, while the U.S. Energy Information Administration (EIA) provides weekly updates on oil inventories and production — both are invaluable for building a well-rounded market view. If you’re refining your technical strategy, don’t miss our in-depth guide on The Fair Value Gap Continuation Strategy, which aligns perfectly with trending conditions like today’s GC and CL setups.