

Table of Contents
📊 Gold Futures Technical Analysis: Waiting for Institutional Reaction at Key Resistance (Dec 18, 2025)
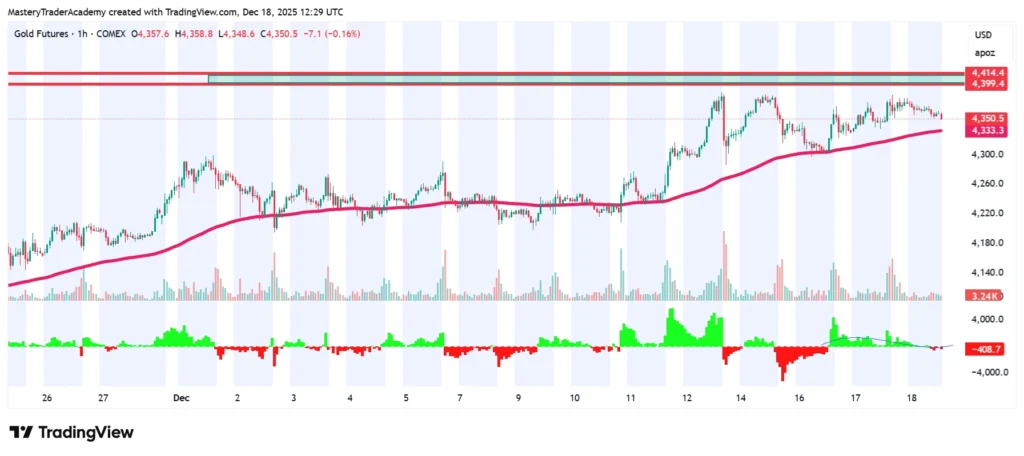
Gold Futures (GC) continue to trade within a strong bullish technical structure, holding above key moving averages and respecting higher-timeframe support. Price action remains constructive, but as always, context matters more than momentum.
At this stage, gold is approaching a critical resistance area where patience becomes more important than participation.
🔴 Key Resistance Zone on the Chart
A major resistance zone has been identified between 4,414.4 and 4,399.4, marked clearly on the chart using a red triangle.
This zone represents:
A higher-timeframe technical resistance
An area of previous selling imbalance
A level where institutional order flow is likely to engage
No trade has been executed yet.
This is a pre-execution technical analysis, not a signal.
📈 Current Gold Price Behavior
At the moment:
Gold is consolidating after a strong bullish expansion
Price remains above the rising EMA, confirming trend strength
Volume has decreased, indicating a pause rather than continuation
This type of behavior typically precedes a reaction zone test, not an immediate breakout or reversal.
🧠 Technical Execution Plan
Once price approaches the 4,414.4 – 4,399.4 resistance zone, execution will be based strictly on price and volume reaction.
The focus will be on:
Rejection or acceptance within the zone
Volume expansion at the highs
Signs of buying exhaustion or selling absorption
A short position will only be considered if price shows clear rejection accompanied by high volume.
📊 The Role of Volume in This Analysis
Volume is the defining factor at this level.
In futures markets:
High volume at resistance signals institutional participation
Institutions execute positions through volume, not indicators
A reversal without volume is unreliable and ignored
If price reaches the zone without meaningful volume, the setup is invalid.
Understanding how volume behaves at key resistance levels is essential for futures traders who focus on execution rather than prediction. Professional traders rely on structure, risk control, and volume confirmation to identify institutional activity, a concept explained in detail in our guide on how professional traders manage futures risk and structure their trades over time, while liquidity data and contract behavior published by CME Group on Gold Futures further highlight why high volume at key levels often reflects institutional participation rather than retail speculation.
❌ What This Technical Analysis Does Not Assume
It does not predict a top
It does not assume a reversal
It does not force a trade
The market must confirm the idea — not the other way around.
✅ Technical Summary
Trend remains bullish until proven otherwise
4,414.4 – 4,399.4 is the key technical resistance
No trade until price reaches the zone
High volume will define institutional intent
Reaction determines execution
📌 No reaction, no trade.
📊 Gold Futures Technical Analysis: Institutional Focus at the 4,414.4 – 4,399.4 Resistance Zone
Gold Futures (GC) continue to trade within a well-defined bullish structure, but as price approaches a major higher-timeframe resistance area, the market is entering a decision phase. This technical analysis focuses on structure, momentum, volume behavior, and institutional positioning — not prediction.
At this stage, patience is the strategy.
📈 Higher-Timeframe Market Structure
From a structural perspective, gold remains in a controlled bullish trend:
Price continues to print higher highs and higher lows
The market is trading above a rising EMA, confirming trend strength
Pullbacks have been corrective rather than impulsive
Buyers remain in control until proven otherwise
However, bullish structure alone is not a reason to buy blindly, especially when price approaches historically significant resistance.
🔴 Major Resistance Zone: 4,414.4 – 4,399.4
The most important technical element on the chart is the resistance zone between 4,414.4 and 4,399.4, which has been clearly marked using a red triangle.
This zone is significant because it represents:
A higher-timeframe supply area
A region where selling pressure previously entered the market
A price level where institutions have shown interest before
A potential area for distribution or rejection
This is not a random level.
It is a decision zone, not an entry zone.
⏳ Current Price Behavior and Market Condition
As of now, gold is:
Consolidating after a strong bullish expansion
Trading slightly below the marked resistance zone
Showing reduced momentum compared to the impulsive leg
Experiencing normalized volume, not aggressive participation
This behavior suggests that the market is pausing, not reversing yet.
Importantly:
There is no confirmation of selling
There is no institutional aggression visible yet
There is no valid short setup at this moment
📊 Volume Analysis: The Institutional Filter
Volume is the key confirmation tool in this technical analysis.
In futures markets:
Price can move without meaning
Volume reveals intent
High volume near resistance is not random. It typically indicates:
Institutional order execution
Distribution of long positions
Aggressive selling entering the market
Low or average volume at resistance suggests:
No commitment
No institutional participation
No trade
This is why volume defines execution, not indicators.
🧠 Technical Execution Framework
The plan is straightforward and rule-based:
Step 1: Wait for Price to Reach the Zone
No trade is considered until price trades inside the 4,414.4 – 4,399.4 resistance area.
Step 2: Observe Reaction, Not Emotion
Inside the zone, the focus is on:
Price rejection or acceptance
Candle behavior (wicks, failures, inability to push higher)
Volume expansion at highs
Step 3: Volume Confirmation
A potential sell scenario requires:
High volume appearing near the highs
Evidence of buying exhaustion
Signs that institutions are defending the level
Without these conditions, no trade is taken.
❌ What This Technical Analysis Does NOT Assume
This analysis does not:
Predict a market top
Assume gold must reverse
Force a short because price is “high”
Trade against trend without confirmation
Markets do not reverse because traders expect them to.
They reverse when liquidity and volume align.
🔄 Bullish vs Bearish Scenarios
Bullish Scenario
If price:
Accepts above the resistance zone
Breaks and holds with strong volume
Shows continuation strength
Then this zone may act as future support, not resistance.
No shorts are considered in that case.
Bearish Scenario
If price:
Trades into the zone
Fails to hold above it
Shows high selling volume and rejection
Then a short setup becomes technically valid, based on reaction — not bias.
🧩 Why Patience Is the Position
Most losses in trading come from:
Entering before price reaches key levels
Trading without volume confirmation
Reacting emotionally instead of technically
Waiting for price to approach the zone is not inactivity —
it is professional risk management.
✅ Technical Analysis Summary
Gold remains bullish until proven otherwise
4,414.4 – 4,399.4 is the key higher-timeframe resistance
No trade until price reaches the zone
Volume defines institutional intent
Reaction determines execution
📌 No reaction. No volume. No trade.
⚠️ Disclaimer
This technical analysis is provided for educational and informational purposes only and does not constitute financial advice, investment advice, or a recommendation to buy or sell any financial instrument. Futures trading involves significant risk, and past performance is not indicative of future results. All analysis reflects personal market observations and technical interpretation at the time of writing. Traders are responsible for their own decisions, risk management, and execution.